
Adnan Aamir
Quetta: Data analysis of district wise census data of Balochistan proves that there is no major change in the ethnic balance of population viz-a-viz Baloch and Pashtun as it was claimed in the run up to the census.
Analysis of the district wise population figures of 6th population census, released on the website of Pakistan Bureau of Statics (PBS), show that population balance of Baloch and Pashtun districts is same as it was in last census.
Ethnic Balance Remains Same
20 Baloch majority districts have population of 6,607,263 and 9 Pashtun majority districts have a population of 3,111,524.
For the sake of this analysis Quetta, Sibi and Kohlu were considered to be districts with mixed population. It’s assumed that population of Quetta comprises of 40% Pashtun 30% Baloch and 30% others communities. Population of Sibi comprises of 40% Baloch, 30% Pashtun and 30% others. Likewise two-thirds of population of Kohlu is Baloch and reminder are Pashtun. This analysis has ignored the Pashtun living in Baloch majority districts and Baloch living in Pashtun majority districts for the sake of simplicity.
Based on the aforementioned assumptions 61% population of province comprises of Baloch and 33% Pashtun. The same ratio based on the aforementioned assumptions was 63:33 in 1998 census.
Again it must be noted that assumptions about mixed districts are made based on educated guesses and real composition of population can be different. Still, the population of mixed districts can’t drastically alter the ethnic balance in Balochistan.
Census results have busted two political rhetorics: Baloch and Pashtun population are equal in Balochistan and there are 3-4 million Afghan refugees in Balochistan
The census results have busted two myths about population politics of Balochistan. First myth was promoted by Pashtun nationalists that Pashtun are equal to Baloch if not more in population. Secondly the census has also busted the myth put forward by Baloch Nationalist parties that there are 3-4 million Afghan refugees in Balochistan.
In the run up to census in Balochistan a campaign was carried out to prevent the inclusion of Afghan Refugees in Balochistan. Even a grand tribal Jirga convened in Quetta in February this year demanded from Federal Government to ensure that Afghan Refugees are not counted in census.
General Imbalance – A Serious Problem
This census also reveals that Balochistan has the biggest gender imbalance in the country among all provinces.
Within Balochistan Makran Division has the biggest gender imbalance, there are 117 men for every 100 women. Nasirabad division has the lowest gender imbalance with 106 women for every 100 men.
Gender imbalance gives birth to scores of social problems because a perfect society requires equal population of both genders. High rate of gender imbalance in Balochistan in general and Makran division in particular, merits studies and investigation in this matter.
No Major Change in Population Patterns
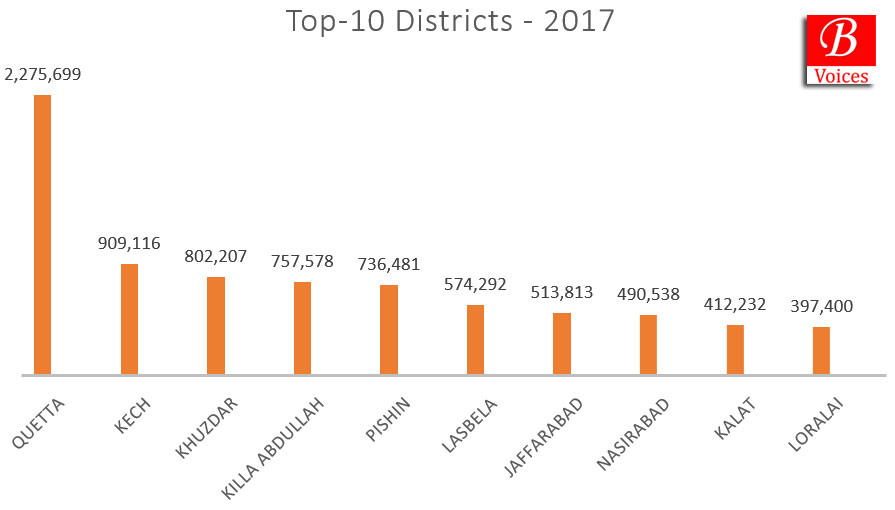
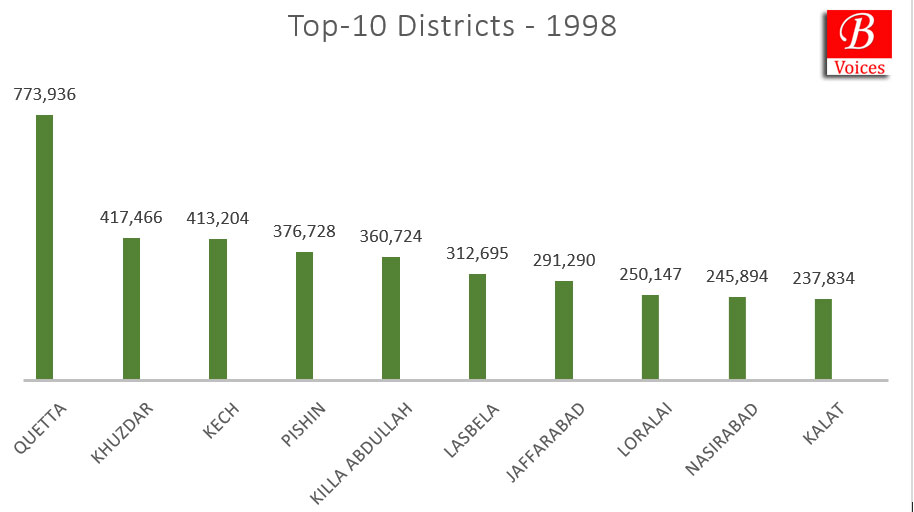
Top 10 districts of Balochistan are same in the 2017 census as they were in the 1998 census. There have been minor changes in the sequence of some districts in the top-10 list but there has been no major change in population.
Quetta is the most populated district of Balochistan with a population of 2.2 Million and Harnai is least populated district with population of a little over 97,000.
Likewise Quetta is the most populated division of Balochistan and Sibi is the least populated division. Same was the sequence in 1998 census and there has also not been any major population shift in any of the divisions.
Disturbing Population growth rate
In Balochistan the census debate is always centered around ethnic balance and the delicate issues such as population growth are an after-thought.
Balochistan observed a population growth of 88% since 1998. That amounts to 3.37% annual growth rate. 7 districts of Balochistan have growth rate of more than 100%. Quetta faced the biggest population increase since 1998 with 194% which translates into 5.83% annual growth rate.
Annual growth rate of more than 2% is considered dangerous and Balochistan and its most populated districts have well surpassed this rate.
Another interesting point is that Qilla Abdullah observed population growth of 110% whereas in the house listing census of 2010-11 growth rate of same district was over 400%. This also proves that house listing census of 2010-11 was grossly inaccurate.
Population not a basis for District formation
Recently Balochistan government formed two new districts and the total number of districts rose to 34.
This census was conducted for 32 districts and the average population for one district is 385,000 on average. However the census data proves that population is not a criterion for district formation.
There are districts which have bigger population than this average such as Quetta (2.2 Million) Khuzdar (800,000) and Qilla Abdullah (750,000) at the same time there are districts with population less than the average such as Harnai (97,000) and Lehri (118,000).
Abnormalities in Census Findings
There are certain interesting points which are discovered during the data analysis of the census data. Sherani district has no urban population and the entire population of district is classified as rural.
Likewise, another major issue which is also under discussion on social media is the negligible increase in population of district Awaran. There was an increase of just a little over 3,000 people in the population of Awaran. The obvious reason can be that people of Awaran have migrated to hub city and other areas in large numbers.
Bottom Line
Census 2017 has already become controversial after it was rejected by almost all political parties of Sindh. However from Balochistan there is a mixed reaction to results of census. This is surprising given the fact that Balochistan was most active province during the pre-census politics.
In the context of Balochistan, census data should be used for much needed planning and development in province rather than for ethnic conflict.
Disclaimer: This data analysis is based on the assumption that census data is fully accurate.
Want to add something to this analysis? Feel free to use the comments section below
Share your comments!


: A New Platform for Independent Discourse on Asia-Pacific Launched")
